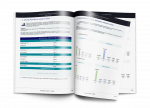
All carrier performance from October 2021 to September 2022 compiled in a single report. A simple visualization, specially revised for this edition, will enable you to easily analyze, compare and benchmark carriers’ service quality.

Delivery performance indicator
Discover the QS benchmark of carriers on video
Download the latest monthly report
Analyze the delivery performance of 2022 with the annual version of the QS Carrier Barometer!
Download the 2021-2022 annual report!
Every year, hundreds of millions of parcels are sent to private customers.
The QS Benchmark of carriers the first and only study to provide independent, comprehensive data measuring the quality of deliveries in Europe.
Find out more about carriers’ performance on a monthly basis:
- – Average delivery times
– Average pick-up times
– Best-served departments
– Consumer ratings
A detailed study of delivery quality published every month.
Our 3 goals
Inform the general public about delivery quality.
Today in Europe, consumers have no indicator to trust when it comes to choosing the carrier who will deliver their parcel. The QS Barometer aims to be this benchmark of trust for the general public.
Offrir un outil de benchmarking aux professionnels de la VAD.
E-Commerce decision-makers need a reliable tool to compare carriers’ quality of service in order to carry out their transport tenders.
The Barometer is enriched by data supplied by VAD professionals.
Develop emulation among transport service providers.
Carrier performance is analyzed and compared on the basis of several quality criteria. With this collaborative and independent tool, the emulation generated helps to improve delivery performance on a European scale.


